Home > Research & Insights >
Insights
Using Data to Reimagine our Mobile Dental Program
Expanding to Rural Areas to Serve Those with the Greatest Needs
Takeaway
The St. David’s Foundation Mobile Dental Program provides free evidence-based oral healthcare, including diagnosis, treatment, prevention, and oral health education for disadvantaged children enrolled in Title 1 Elementary Schools. In the 2022-23 school year, the program served six School Districts and three Charter Schools in Travis, Williamson, and Hays counties.
Since the Mobile Dental Program began in 2000, the team has conducted over 227,000 dental visits, treated over 100,000 patients, and placed over 93,000 sealants, totaling nearly $100 million ($99.33M) invested in dental treatment for our community.
St. David’s Foundation recently adopted a new strategic vision and direction, focusing on health equity, especially for those in rural communities. As the Foundation continues to evolve to address growing health disparities in our region, so must the Mobile Dental Program to ensure we are providing services to those with the greatest needs.
The Foundation leverages a combination of research, evidence, and community voice to create and implement data-driven strategies designed to reduce health disparities for those communities facing the greatest need with a goal of advancing health equity across Central Texas. As part of this approach, the mobile dental staff analyzed data on community needs and assets to better understand how its current service area reflected the geographic areas of highest need. Data on its current service areas revealed that Austin and surrounding areas have recently experienced an increase in the overall cost of living, forcing residents with a lower socio-economic status to relocate to more rural counties farther outside of Austin.
Key Findings: Bastrop County
Research, data collection, and analysis on rural counties surrounding Travis County revealed disparities in health care access and community conditions that are likely resulting in children going without dental care. Of the rural counties researched, it was determined that Bastrop County maintained the greatest need for service; the findings below highlight the disparities between Bastrop and Travis counties related to oral health.
School Enrollment and Demographics
- Enrollment in Bastrop ISD (K-5) has increased by 4.32% from the 2017-2018 school year to 2021-2022, resulting in over 200 additional students.1
- During the same period, enrollment in grades K-5 decreased by 9% across the six school districts served by the Dental Program and by 13.5% in Austin Independent School District (AISD).1


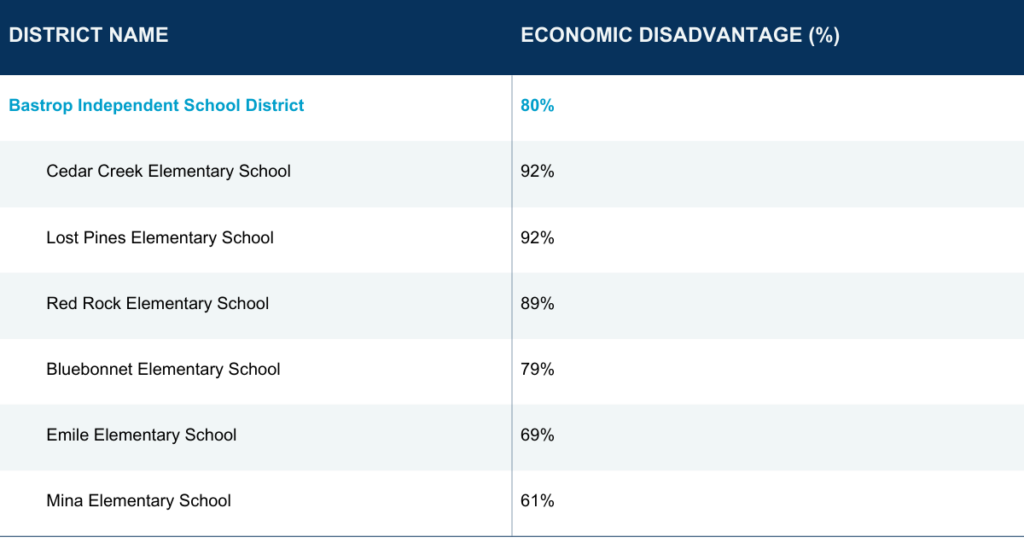
- Alongside the uptick in enrollment, the economic disadvantage % for Bastrop District (including Kindergarden -5th grade students not directly served by St. David’s Foundation) increased from 69% to 70% during the same comparison period (2017-2018 to 2021-2022); economic disadvantage declined by 3.77% in AISD.2 Socio-economic factors such as family income level and economic disadvantage have been significantly associated with untreated caries among children.3 Further, economic disadvantage has been linked to children not brushing their teeth, not receiving dental health education, and never seeing a dentist.4
- Economic disadvantage % in Elementary Schools to which the Dental Program directly provides service averaged at a much higher 80%.
Insurance Coverage
When comparing insurance coverage between Bastrop and Travis Counties, it was discovered that 23% of the Bastrop population is uninsured, compared to the 16% in Travis County.
- Additionally, when looking specifically at uninsured children, 15% of children in Bastrop are uninsured compared to 12% in Travis County.5
Dental Care Shortage Areas
Comparing Dentists per 10,000 residents, Bastrop County has only half as many compared to Travis County:
- Bastrop has three dentists per 10,000, while Travis has seven dentists per 10,000.6
Additionally, when reviewing these counties through the lens of Dental Care Shortage Areas:
- All of Bastrop County is considered a dental care shortage area, while only a part of Travis County is regarded as a dental care shortage area.7
Shortage Of Dentists Accepting Public Insurance
The Texas Health and Human Services reported that in September of 2022, there were 16,9448 children enrolled in Medicaid in Bastrop County. Bastrop has around 3-4 dental facilities that accept Medicaid, one of which requires that families must pay upfront, and the dental office submits the claim to Medicaid for later reimbursement if approved. This translates to about about 5,648 children per dental office. Meanwhile, Travis County reported 114,5998 children enrolled in Medicaid and approximately 23 dental offices accepting Medicaid. Therefore, Travis has a ratio of about 4,900 children per Medicaid dental office. (Not including FQHCs and low-fee clinics).
Geographic Isolation and Lack of Transportation
- The mean travel time to work in Bastrop County is 35.5 minutes – compared to 25.9 minutes in Travis County.9
- Further, Bastrop County lacks public transportation options compared to Travis County, which has the Capital Metro public transit, including bus services, rail service, UT Shuttles, metro bike, and rideshare. Residents in Bastrop County have reported not having access to personal transportation, and 4.5% of households have reported not owning a personal vehicle.10
Fluoridation
Fluoridated water protects teeth – Drinking fluoridated water keeps teeth strong through a repair process called remineralization and reduces and protects against dental decay by about 25% 11 in children and adults.
In 2020, the Census Bureau reported that Bastrop had 97,216 residents.9 The Centers for Disease Control and Prevention (CDC) reported that only 15,519 of Bastrop’s population has access to Fluoridated water. Therefore, approximately 84% of Bastrop’s population does not have access to water Fluoridation.12
- During the same time frame, the Census Bureau reported 1,326,436 residents in Travis County. The CDC reported that 1,152,494 have access to Fluoridated Water – approximately only 13% of the population in Travis does not have access to Fluoridated water.
Conclusion
Informed by the above data, the Dental Program developed a pilot project with a rural school district in Bastrop during the summer of 2023. This coming fall, the team will measure outcomes and evaluate data to help inform decision-making and planning for the 2024-25 school year. In particular, the program will be assessing how it can most effectively reach socially and economically disadvantaged children in rural communities and further identify what model of care—including staffing and operations—is most effective in serving rural communities.
References
- Texas Education Agency. Public Education Information Management System Reports. Student Enrollment Reports – KG to 5th Grade Years: 2017-2018, 2018-2019, 2019-2020, 2020-2021, and 2021-2022. Recovered from: https://tea.texas.gov/
- Texas Education Agency. Public Education Information Management System Reports. Student Program and Special Populations Reports Years: 2017-2018, 2018-2019, 2019-2020, 2021-2022, 2022-2023. Recovered from: https://tea.texas.gov/
- Gupta N, Vujicic M, Yarbrough C, Harrison B. Disparities in untreated caries among children and adults in the U.S., 2011-2014. BMC Oral Health. 2018 Mar 6;18(1):30. doi 10.1186/s12903-018-0493-7. PMID: 29510696; PMCID: PMC5840689.
- Aslan Ceylan, J., Aslan, Y. & Ozcelik, A.O. The effects of socio-economic status, oral and dental health practices, and nutritional status on dental health in 12-year-old school children. Egypt Pediatric Association Gaz 70, 13 (2022). https://doi.org/10.1186/s43054-022-00104-3
- County Health Rankings. Compare Counties – Bastrop vs. Travis (2022). Recovered from: https://www.countyhealthrankings.org/
- Rural Health Information Hub. Rural Data Explorer – Dentists per 10,000 (2020). Recovered from: https://www.ruralhealthinfo.org/data-explorer?id=199&state=TX
- Rural Health Information Hub. Health Professional Shortage Areas: Dental Care, by County, 2022 – Texas. Recovered from: https://www.ruralhealthinfo.org/charts/9?state=TX
- Texas Health and Human Services. Healthcare statistics – Medicaid and Chip Enrollment, September 2022 Historical Medicaid Enrollment by County. Recovered from: https://www.hhs.texas.gov/about/records-statistics/data-statistics/healthcare-statistics
- United States Census Bureau. Quick Facts by County. Recovered from: https://www.census.gov/
- Bastrop County 2021-2022 St. David’s Foundation – Community Health Needs Assessment.
- Centers for Disease Control and Prevention. Community water fluoridation. Recovered from: https://www.cdc.gov/fluoridation/index.html
- Centers for Disease Control and Prevention. Community water fluoridation. Recovered from: https://www.cdc.gov/fluoridation/index.html
Meet our Contributors